Real-time Pattern Detection in Customer Behavior

Delivering personalized messages to users is a daunting task as it involves two intricate processes:

  • Extraction of behavior patterns out of vast amounts of unstructured customer interaction data, across all channels.
  • Generating patterns across multiple events to predict possible next action of your customer.

To complicate matters, delivering personalized messages when the user is active at any of the touch-points requires you to drive these predictions in real-time. Only then can you deliver messages that have relevance and create the right experience.

To achieve this goal, it is important to set up a system that is capable of detecting patterns and predicting options in real-time, in order to implement a highly effective personalization mechanism for your business.

How does it work?

For a machine to personalize and drive the user to the desired goal path, it would need to match and deduce the next best event and target message that will drive him to the goal path. This computation needs to be done in real-time in order to personalize instantly when the user is active.

This real-time computation would require (a) appending current session behavior pattern to past behavioral pattern of the current user and (b) the deviation of the current user path to the most optimal goal paths in relation to a specific product.

With these parameters, the algorithm calculates the differential to arrive at the next closest pattern leading to the goal. As the user interacts, the algorithm appends the new action and re-adjusts to output the closest probable.

purchasey

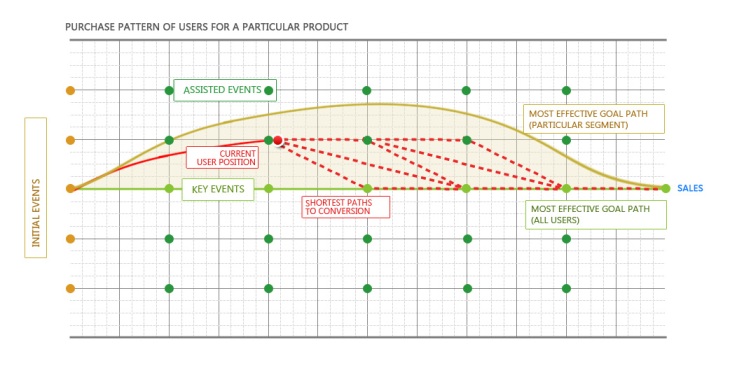
In the example diagram above, the pattern of user interactions is mapped from the initial event to the desired goal path. After analyzing user’s interaction flow for a single product, we arrive at the most effective conversion pattern. To fine-tune our chances, we also generate another effective conversion pattern by just using user interaction patterns, belonging to the segment of the browsing user.

The area analyzed shows the effective probable purchase zone for the given product, which is used to map the relation with the current browsing pattern of the user. Now whenever the user’s pattern is constructed in real-time, the algorithm for matching patterns can quickly locate area coordinates and return the nearest event node to deduce possible pattern extensions.

If there are more than one probable, the automation queues up the probable next events for follow-up targeting, based on the results of the targeted message. The marketer can configure multivariate tests to ensure that the right options are learned and exercised in real-time increasing effectiveness of personalization campaigns.

This automation can drive every user to the desired goal path and can be configured to perform across various stages of the customer lifecycle. This will help businesses to bring back drifting prospects or reduce customer churn with negligible attrition.

To enable effective personalization for your business across all customer touch-points, do get in touch with the Plumb5 Analytics Team.


Activating Prestashop API/Web Services to access data

To do this, simply go into your Back Office and click on the tab Tools / Web Service.

Select “Enable Web Service” and click Save to activate the service

Prestashop Backoffice


Generating a. htaccess file:

To get the web service to work, you need to generate / regenerate a. htaccess file. While still in the Back Office, go to the Tools / Generators tab and click:

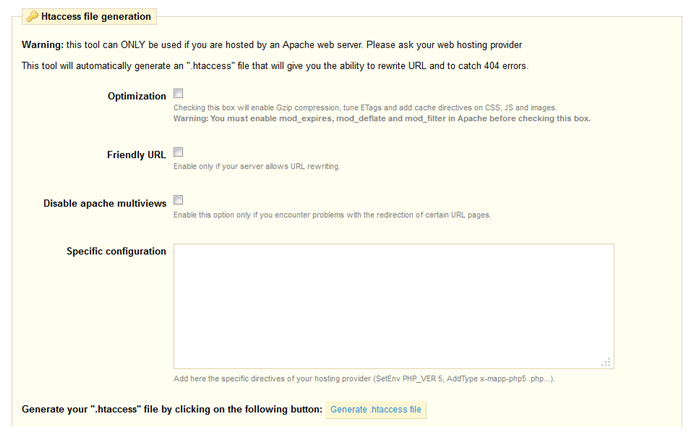
Prestashop - HTA Access


Creating access:

Return to Tools / Web Service

– Click “Add New “, and you’ll access the “passkey” permission and definition page.

– Click on “Generate.” This will generate an authentication key.

ps7


In the list of permissions, the left button allows you to define all the rights for a given resource. Select the resources you need to manipulate from your application; in our case check the first check box in the “customers” row and then: – Press “Save”


Visualizing Product Performance & Conversion Rate

With Product list integration, you can now dish custom reports based on categories, sub categories or by individual products. You can even create custom product related reports and gather insights by adding various filters

Product-wise Performance Report

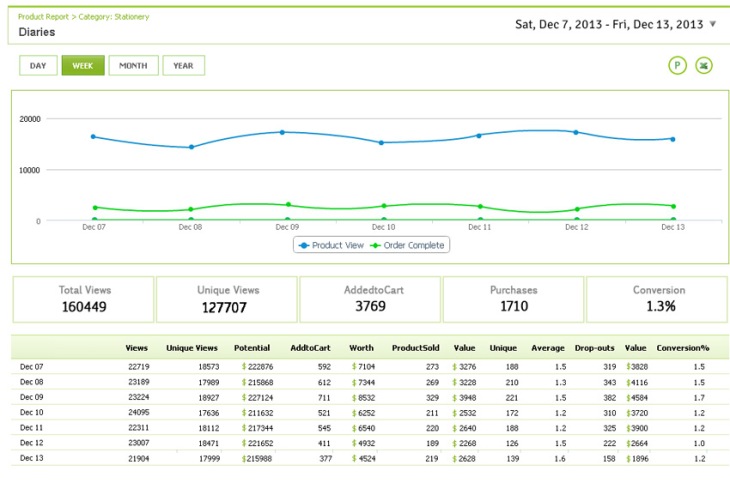
The report screen is a weekly report of an individual product. The report is customized after integrating product and purchase data from your store platform. This reports enables the marketer to monitor the conversion rate and identify susceptible pages in the goal paths causing drop-outs and plan optimization techniques

Plumb5 Product Report
READ ME
Views: Total Views the product received)
Unique Views: Total Unique Visitors who viewed the product
Potential: Total Potential Sales, considering all the  unique visitors purchased at daily average(order)
AddtoCart: Total Unique Visitors who added the product to the cart
Worth: Total Worth, considering all the unique visitors who added to cart, made a purchase
Product Sold: Total Product sold
Value: Total successful purchases
Unique: Total Unique Customers who purchases the product
Average: An average number of products, every unique visitor purchases
Drop-outs – Total Unique Visitors who added to the cart but did not make the purchase
Value:  Total Unsuccessful purchases
Conversion Rate: Total Percentage of successful purchases(value) with respect to total unique visitors who viewed the product (Potential)

Visitor Scoring and Segmentation

Start monitoring customer’s behavior on the store, by integrating customer id of your store platform, to sessions on Plumb5.   You can assign scores to their behavior and start automating conversion campaigns

vs1

The above graphic represents the profile of the visitor, where you can find scores assign to him. The above graphic tells us that the visitor frequency to the site has lowered, though he had visited recently. You can also see that the visitors page depth has lowered too which is an indication that the visitor is drifting away.

In this situation, you can enable a personalized tactical message to this user to be able to drive more excitement

Continue reading →

Sync SalesForce contacts with your Plumb5 account

Integrating Salesforce contacts

You can synchronize your SalesForce contacts by just configuring the API access and token. The contacts will be available in Plumb5 Contact base, where you can start engaging them through mail and onsite campaigns. Now, you have access to the contacts behavior and social preferences. You can segment your contacts based on behavior and run personalized campaigns to monitor responses.

Setting it up

Log in to your Plumb5 account and click on the manage account link to get to the configuration tab

Continue reading →

Aligning interaction data to monitor customer spends

Customer Transaction Cards is a customer profitability application designed to create statement of transactions of each customer to effectively manage customer spends.

The application is integrated with the CUI string module, to align interaction data of a single customer, in date sequence, so as to understand the staging process of the customer and the relevant costs involved at each touch-point

Each customer’s interaction history is designed like a bank statement with credits and debits added to each interaction, where revenue earned is considered as credits and every spend on invitations or, product discount or periodic interests, is considered as debits

The following statement example shows how customer interaction data is aligned by interactions along with associated credits, debits and balance.
Continue reading →

Customer Data Unification

Customer data can be aggregated and unified, using web services offered by marketing tools housing customer data. But the challenge is to aggregate, unify, derive insights and applying it to actions in real-time. To address this challenge, Plumb5 CI platform, tags and scores data in real-time and extends it to personalization and messaging campaigns.

The graphic illustrates the aggregation approach, comparing traditional solutions with Plumb5

Data aggregation for unified profiling

To know more about our integrated customer tagging, click here to understand the system and method for customer identification using a real time unique string

Cohort Analysis

Cohort analysis helps measure users who share common characteristics over a period of time. Cohort Analysis can be used to measure subscription attrition, user engagement or to estimate lifetime value. For example, when we do a cohort anlaysis for understanding traction in user engagement, we group people based on their joining date. The people who joined our service in January make up the January cohort, the people who joined in February make up the February cohort, and so on which is further analyzed to understand how each cohort stays engaged over time.
Continue reading →